Angular Benchpress and Performance Tests

Ben Nadel wrote a blog post that explored the performance of rendering a large dataset using Angular (version one) and React. It was a good post and demonstrated the perceptible difference between an Angular 1 application and a React application. The example application (found here) was intended to give a feel for this performance difference.…
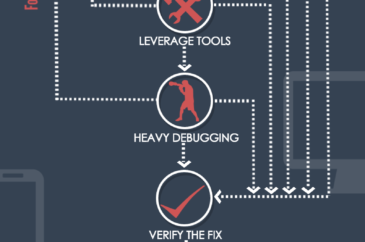
The Debugging Process

(function(d){ var js, id="pikto-embed-js", ref=d.getElementsByTagName("script")[0]; if (d.getElementById(id)) {return;} js=d.createElement("script"); js.id=id; js.async=true; js.src="https://magic.piktochart.com/assets/embedding/embed.js?UID=3271151-the-debugging-process"; ref.parentNode.insertBefore(js, ref); }(document));

Do PDB Files Affect Performance?

After a detour into Historical Debugging, it’s time to come back to return to answering questions about PDB files. Here’s a question from Justin: Thanks for the great post once again. I was looking forward to your debugging virtual training, but unfortunately it was cancelled. The company I work for is pushing pack against building…

The Art of Debugging

Mastery of the art of debugging is rare. I know this from years of experience working on enterprise systems. If it was simple, more people would be doing it and everyone would be able to track down bugs. The reality is that most shops have that one “go to person” known as “The Exterminator” who…

Jounce Part 11: Debugging MEF

The Jounce framework specifically relies on the Managed Extensibility Framework to help solve MVVM concerns. I recently presented an introduction to MEF and explained what I believe are the four core problems it solves: Discovery — it’s good to decouple, but at some point you need to provide an implementation, and MEF does a great…

Performance is Never Loosely Coupled

Yes, yes, oh god, yes! All “When Harry Met Sally” references aside, one of the most important performance statements you will ever read in your development life is expressed below from Rico Mariani. We see this anti pattern constantly in our consulting and debugging business here at Wintellect. Please, please, please read his blog entry…

Performance Profiling Silverlight 4 Step-by-Step

It turns out you can profile Silverlight 4 applications. Really! But the steps are scattered about the web in bits and pieces, so I wrote this to pull them all together. I’m going to use my reference X-Fit application for this, but you can obviously insert your own. Here we go! Set up PowerShell Yeah,…

Super Cool MSBuild Debugging In the VS IDE!

Have you ever tried to figure out why your MSBuild-based build is failing? While the diagnostic output is OK, it really isn’t an each task (no pun intended) to debug what’s going on in an MSBuild file with the traditional means of <Message> tasks. Fortunately, Dan Mosely, one of the MSBuild developers, had some time…

VS Remote Debugging Across Workgroups or Domains

Remote debugging in Visual Studio works great if both machines are on the same domain and/or workgroup. It also works dreamily if you’re doing straight native C++ where you can use the TCP/IP as the debugging transport. The problem comes in when you need to do remote debugging for managed code across domains or workgroups.…

Debugging and Performance Tech Focus

Wintellect is so much more than just me posting a random blog entry every once in a while. This year our big marketing focus is to offer unique and interesting content for developers. To that end we’ve set up our Tech Focus which you can sign up for here. This gets you special articles each…