Statistics is becoming a must learn topic for anyone looking to get into data science. Look at any data scientist job posting, and you will be hard-pressed to find a listing that does not mention a degree in statistics, mathematics, or some experience in analytics as a minimum qualification. Courses in data science are including an introduction to statistics as part of their curriculum. As you can see, there is no avoiding statistics in regards to data science.
In this post, we’ll cover some basic concepts of data types in statistics and a few ways on how you can collect your own data.
Why Learn Statistics?
One of the central concepts of data science is gaining insights from data. Statistics is an excellent tool for unlocking such insights in data. Statistics is a form of math, and it involves formulas, but it doesn’t have to be that scary even if you’ve never encountered it before.
Machine learning came from statistics. The algorithms and models used in machine learning all come from what’s called statistical learning. Knowing some basic statistics is extremely helpful whether you are deep into machine learning algorithms or just staying up-to-date on the latest machine learning research.
Even if you don’t want to get that deep into machine learning, these basics will get you on the right path to exploring and extracting meaning from your data. Doing this alone can give your business the upper hand by knowing that the data has statistical significance or not.
Types of Data
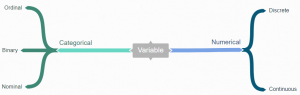
There are two types of variables you’ll find in your data – numerical and categorical. Numerical data can be divided into continuous or discrete values. And categorical data can be broken down into nominal and ordinal values.
Numerical
Numerical data is information that is measurable, and it is, of course, data represented as numbers and not words or text.
Continuous numbers are numbers that don’t have a logical end to them. Examples include variables that represent money or height.
Discrete numbers are the opposite; they have a logical end to them. Some examples include variables for days in the month, or number of bugs logged.
It’s important to note here something you’ve probably heard before – correlation does not mean causation. What this means is that even though two variables may be correlated, doesn’t mean that one variable causes the second variable to react. There may be a relationship between them, but there could be other factors as to the cause of the relationship.
Categorical
For categorical data, this is any data that isn’t a number, which can mean a string of text or date. These variables can be broken down into nominal and ordinal values, though you won’t often see this done.
Ordinal values are values that have a set order to them. Examples of ordinal values include having a priority on a bug such as “Critical” or “Low” or the ranking of a race as “First” or “Third”. Nominal values are the opposite of ordinal values, and they represent values with no set order to them. Nominal value examples include variables such as “Country” or “Marital Status”.
In addition to ordinal and nominal values, there is a special type of categorical data called binary. Binary data types only have two values – yes or no. This can be represented in different ways such as “True” and “False” or 1 and 0. Binary data is used heavily for classification machine learning models. Examples of binary variables can include whether a person has stopped their subscription service or not, or if a person bought a car or not.
Collecting Data
Regarding big data, you typically have the four Vs – volume, veracity, velocity, and variety. Another V exists that is important for your data – validity. There’s an adage in programming – “Garbage in, garbage out.” The quality of your analysis depends on the quality of your data.
Sometimes, as a data scientist, you may need to collect the data you’ll be analyzing. Collection data may consist of sending out surveys, polls, or doing other experiments. During this collection, data can sometimes become contaminated which will yield less accurate analysis or contribute to making the wrong business decisions. Let’s review a few ways to collect the most accurate data.
Sampling
In statistics, since it’s not possible to get data from every person or device to do analysis on (data on everyone or everything is called, in statistics, the population). Taking a sample of the population is often enough to get an idea of the whole. You may already do something like this with your own data; take a small part of it to do analysis on rather than using the entire data set.
There are many ways to take a sample, but we’ll only go through a few – simple, stratified, and cluster.
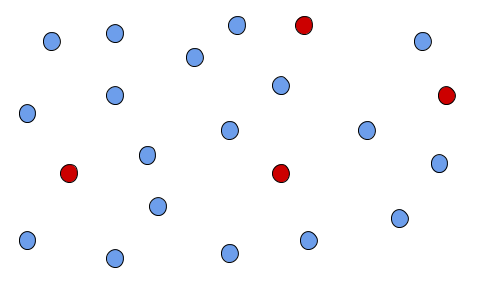
Taking a simple sample is the same as a raffle. The entire population has an equal chance of being selected. Each selection has no bearing on the next selection.
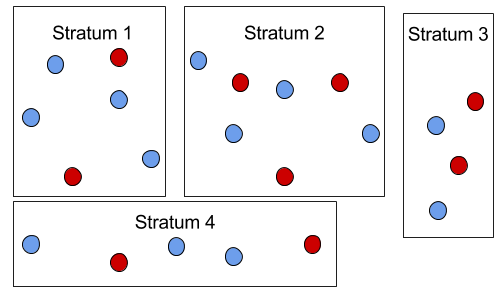
A stratified sample divides out the population into groups, and within each group’s population, a sample is randomly selected.
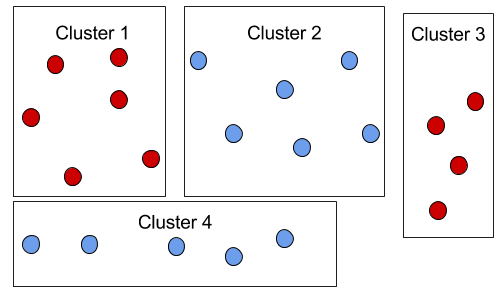
Finally, there is a cluster sample, it’s similar to a stratified sample, in that it divides the population into groups. However, instead of randomly selecting within each group, the whole group is involved in the sample.
Now that we know about different types our data can have, our next post will take this a step further and show different ways to analyze these types of data.
